
Millennial turnout, soft voters to will be key to election outcome
May 4, 2017 – With just five days left in the 2017 provincial election campaign, a new public opinion poll from the Angus Reid Institute finds the governing BC Liberals and the opposition New Democratic Party locked in a tight race, with the Greens of BC adding pressure on, and potentially taking avenues away from a New Democrat victory.
Each party has distinct advantages and disadvantages ahead of the May 9 result, with the eventual outcome hinging on a number of factors, including strategic voting, the possibility of complacency among soft Liberal voters, the rate at which different age groups vote, and the geographic distribution of party support around the province.
This comprehensive analysis of the voting landscape considers these factors, as well as British Columbians’ views of key planks in the parties’ platforms, the appeal of the party leaders, and the overall mood of the province after 16 years of BC Liberal government.
Click here for the full report including tables and methodology
Key Findings: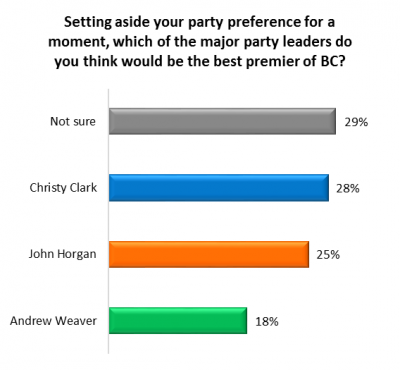
- Both main parties boast their own regional strongholds – the Liberals in the interior, the NDP in the Lower Mainland. Neither party, however, holds a lead across each region of B.C.
- Two-in-three (66%) British Columbians prefer the NDP’s budget strategy of more spending on social programs paid for by tax increases
- The Green Party is polling higher than it has ever performed in a B.C. election, but Green voter support is shakiest compared to that of the other parties
INDEX:
-
Introduction
-
PART 1 – The mood of the province
-
PART 2 – The issues and the party platforms
-
PART 3 – Voter certainty: Soft vs. solid party voters
-
PART 4 – Leadership
-
PART 5 – Vote dynamics
-
PART 6 – The Choice: Vote intention and Paths to victory
Introduction
The Angus Reid Institute is a non-partisan, not-for-profit research organization established to enhance and encourage a better understanding of public opinion trends. In keeping with the Institute’s mandate, this BC Election survey probes beyond the party standings and seeks to explore not only the surface issues in front of the British Columbia electorate, but also the deeper undercurrents such as the parties’ regional vote strength, strategic voting, and the solidity of vote intention that may impact voter choice next week. This work was self-commissioned and funded by the Institute and not by any client.
PART 1 – Mood of the province
Economic anxiety
Recent research by the Angus Reid Institute has shown British Columbians to be among the most optimistic Canadians when it comes to their expectations for the future of their country, their province, and their communities. But there is another undercurrent in B.C. society today: one of persistent anxiety about the rising inequality in one of the country’s strongest economies.
What develops is a distinct cleavage among the electorate: those who have emerged as “winners” over the last four years, and those for whom the last four years have left them feeling like they can’t get ahead. Consider the following findings:
- Roughly seven-in-ten British Columbians (72%) agree with the statement “Too many people in B.C. are being left behind,” and a similar number (71%) agree that “Rising inequality is a huge problem in B.C. today”
- Nearly six-in-ten (58%) say they know someone who works part time because they can’t find full-time work, and almost two-thirds (63%) disagree with the statement “I’m never really stressed about money”
- One-in-three (34%) are worried that someone in their household will lose a job in the next year
This last concern – about a job-loss in one’s own household – is strongest among those with lower incomes, as seen in the following graph:

On other economic measures, it is young British Columbians who feel most strongly. Fully eight-in-ten of those ages 18-34 agree with the “too many people are being left behind” statement, and more than three-quarters disagree with the “I’m never really stressed” statement:

For additional findings related to economic anxiety by age and income demographics, see comprehensive tables.
Are things improving or worsening?
This undercurrent of economic anxiety can be seen in British Columbians’ assessments of their finances and quality of life – they are more likely to say each of these aspects of their lives have worsened than to say they have improved:

It’s notable that British Columbians are three times as likely to say the province’s financial situation has worsened as they are to say it has improved. This, despite the fact that relative to the rest of the country, BC has seen consecutive years of balanced budgets and economic growth: long central to the governing BC Liberals’ campaign strategy.
Are British Columbians better off than they were four years ago?
A similar pattern appears when British Columbians are asked a similar question about the four years since the last election.
The largest number of respondents (49%), say their lives are about the same now as they were during the last provincial election in May 2013. And, again, residents are more likely to say they are “worse off” (32%) than “better off” (19%) now.
Perhaps tellingly, those with household incomes of $100,000 or more per year are substantially more likely to say they are better off than worse off, while those with incomes less than $50,000 are much more likely to say they are worse off:

This finding feeds into a widely-held narrative about the BC Liberals and Premier Christy Clark: That they only care about the wealthy and big business. A previous Angus Reid Institute poll found more than three-quarters of British Columbians agree with a statement to this effect.
That said, more than six-in-ten (62%) said in that previous poll that the opposition parties in the province lack a real plan to help British Columbians.
PART 2 – The issues and the party platforms
Health care, housing top the public’s agenda
When voters are asked what they consider most important in deciding which candidate to support, most (70%) say “the party’s policies on the issues.” But what policies, and what issues, are most important?
Asked to choose up to three top issues in this election, British Columbians are most likely to choose health care (50% do so) and housing prices/affordability (35%). Other key issues – those chosen by at least 15 per cent of British Columbians – are shown in the following graph:

What respondents feel is important varies considerably by their age, where they live, and their voting intention: health care is the top issue overall, but it’s especially salient in the Interior (where 60% name it as a top issue) and among those ages 55-plus (60%).
Housing prices, meanwhile, are more relevant to respondents in the Lower Mainland (43%) and its outskirts (36%), and among those under age 35 (58%), many of whom are feeling priced out of the Metro Vancouver housing market.
Those who plan to vote for the governing BC Liberals voters are more likely to choose “the economy” (44% do), while would-be NDP voters are more likely to choose “housing” (41%).
See comprehensive tables for greater detail on the top issues in B.C. today.
Policy preferences
The parties have each released their platforms and sparred in the debates over key issues. But where do British Columbians fall on the major proposals? The Angus Reid Institute presented several ‘policy faceoffs’ with no party alignment, to get a blind assessment. The electorate is divided on most of these faceoffs, but prefer one key element of the New Democrat approach – their budget plan.
Provincial budget:
Many, if not all elections, are decided on fiscal issues. The BC Liberals built their campaign on another balanced budget and messaging on fiscal prosperity and prudence.
And although British Columbians support balanced budgets, they would like both the amount spent on programs and the taxes collected by the government to rise in parallel.
Presented with the broad budget plan put forth by each party, two-thirds (66%) say they support the NDP strategy of increasing spending while raising taxes on the wealthy and on foreign real estate investors:

MSP premiums:
Another noteworthy item in that February budget: the announcement that Medical Services Plan (MSP) premiums would be cut by half in 2018. Critics, including the opposition parties, have noted that premiums have increased steadily in recent years, doubling since the BC Liberals took power in 2001.

Both the NDP and Green Party have run on a campaign promise to eliminate MSP premiums altogether. Green Party leader Andrew Weaver has stated that his government would roll MSP premiums into the income tax system to eliminate what both parties call a regressive tax on lower-income British Columbians.
NDP leader John Horgan faced criticism from both Clark and Weaver for a lack of clarification over how his party would fund the promise, with some speculating that his party will employ the same strategy as the Greens.
British Columbians are split on the proposal overall. Half say the Liberal plan of a 50 per cent reduction is the best path forward, while half support the full elimination of MSP premiums:

Housing and real estate:
Asked to choose between a renter rebate of $400 per household (in conjunction with a 2% tax on absentee owners) OR the BC Liberals’ offer of loans of up to $37,500 for first time owners, B.C. residents lean toward the renter rebate – the NDP plan. Those in the Lower Mainland are particularly supportive, as are those under 55.

Pipelines and Kinder Morgan:
The TransMountain pipeline expansion was one of the defining issues of the 2013 election, and will again factor into this year’s vote. While the project has been approved by both the federal and provincial governments, John Horgan has stated that the project is not in BC’s best interests. Andrew Weaver also opposes it. A slight majority in the Lower Mainland oppose the project, while the inverse is true in the Interior and in the suburbs surrounding Metro Vancouver:

Bridge tolls:
Andrew Weaver may call it “bad public policy”, but both the NDP and Liberal platforms contain promises to reduce the bridge tolls on the Port Mann and Golden Ears bridges. Four-in-ten (41%) British Columbians support the elimination of tolls on both bridges, while one-in-three say a cap of $500 per year should be instituted. Just under three-in-ten (27%) say that the current system should stay in place.

PART 3 – Voter certainty: Soft vs solid party voters
Differences in British Columbians’ economic realities and views on platform and policy issues strongly relate not only to vote intention – but to the intensity of that intention. Within each party’s support bases, this survey finds blocs of hardcore backers committed to their choice, and blocs of “soft” supporters, who say they could yet change their minds in this election.

Who are the BC Liberal voters?
More than half of Liberal supporters (58%) can be described as “solid.” These are people who have either already voted at an advance poll, or say they are “absolutely certain” of who they will vote for on May 9.
Overall, solid Liberals are feeling pretty good about life in British Columbia today. They’re more likely to say their own financial situation and the province’s have improved, rather than worsened, in the last year, and they see quality of life improving in their community as well. Nearly all of them say they’re either better off (44%) or the same (53%) now as they were four years ago.
Soft Liberals (42% of Liberal base) are those who say the Liberals are their first choice, but aren’t quite willing to lock in their vote yet. They are more than twice as likely to hold an unfavourable view of the Premier but four-in-five still say the BC Liberals are the most qualified party to govern.
Who are the New Democrat voters?
The New Democrats’ solid supporters – those who have already cast a ballot for the party or are certain they will, make up 57 per cent of the NDP foundation. This group tends to be older than its softer counterparts.
Only four-in-ten solid (40%) and soft (40%) NDP voters say that if you work hard in BC you will be successful – suggesting they believe that upward mobility is not available to all in the province. Comparatively, more than eight-in-ten solid Liberals (85%) agreed with that statement.
Soft NDP supporters make up 43 per cent of the current NDP base. Almost half of them (48%) reside in the Lower Mainland, while one-in-five (18%) are on Vancouver Island or the North Coast, where they will be heavily courted by Green candidates.
One-in-five (20%) from this group say they did not vote last time, owing to their younger age or lower political participation.
Who are the Green voters?
Solid Green voters make up 41 per cent of the Green base, which leaves the Green Party with the shakiest support compared to the BC Liberals and BC NDP. This group is significantly more likely than any other group to be located in the Vancouver Island/North Coast region.
They skew heavily female, but are consistent in terms of age demographics.
Soft Green supporters have financial concerns. Just under one-in-three say they are never stressed about money, the lowest among all six sub groups. They don’t much like Christy Clark, nine-in-ten (93%) say she is untrustworthy, and they are fond of Andrew Weaver – nine-in-ten (89%) hold a favourable view of him. 60 per cent say John Horgan is untrustworthy.
PART 4 – Leadership
No clear winner on best premier or best party to form government
On the question of leadership, it appears that no party leader has separated from the pack. Respondents were asked to consider this question regardless of their party preference. Christy Clark sits in a statistical tie with John Horgan over who would make the best premier:

The big winner on this question is no winner at all; ‘not sure’ garners 29 per cent of responses.
When it comes to which party is best suited to govern, the number of uncertain respondents drops, and the BC Liberals have the edge:

Little love for Christy Clark
If the premier has one major problem heading into Election Day, it is how she, herself, is viewed by residents of the province. Asked whether they view each of the leaders favourably or unfavourably, Clark lags well behind both John Horgan and Andrew Weaver.
Slightly more than one-third of British Columbians (35%) hold a favourable view of the premier, a trend that has held for the better part of her tenure. More than six-in-ten (60%) lean the other way on Clark, saying they hold an unfavourable view of her.
Clark’s low favourability can be partially attributed to her weaker standing with her own partisans than those other leaders with their own. More than one-in-four soft Liberals (26%) say they view her unfavourably. This is 10 percentage points higher than the number of soft NDP supporters who say this of Horgan, and nearly nine times as high as the number of soft Green supporters who say this of Weaver:

Two measures help to further inform why many hold this view of Clark. Seven-in-ten British Columbians (70%) say they find her “untrustworthy,” and nearly eight-in-ten (78%) say she stands for her political donors and big business rather than “someone like me”. Strikingly, this latter view is held among almost two-thirds of soft Liberals (65%), who nevertheless say they intend to vote for the premier’s party:

The premier makes up ground on her perceived vision and competence: a majority of British Columbians (60%) say that the Liberal leader has a vision for B.C. On the question of her competence, British Columbians are split evenly, with most of the support coming from those who say they will vote for the Liberals on May 9.

Higher marks for Horgan, but unstable ground with soft voters
The story for John Horgan is more positive, but there are indications he hasn’t necessarily capitalized on the incumbent Clark’s unpopularity. One of his problems is favourability among soft voters.
While about half of soft Liberal voters (52%) and even more soft NDP voters (54%) view Andrew Weaver favourably, just one-in-three soft Greens (36%) and one-in-five soft Liberals (22%) say the same of Horgan. In an election where every on-the-fence voter counts, this is doubtless cause for concern among New Democrats.
Another advantage over Christy Clark is on perceived competence. Nearly six-in-ten (58%) say the NDP leader is competent, six points higher than the Premier. Slightly more B.C. residents (60%), however, say that he stands for his political donors and union bosses rather than people like them, an indication that the party’s decision not to ban big money from its coffers may have affected its competitiveness on this issue:

‘Heart’ holds advantage for Weaver
The campaign has seen the Green Party emerge as a viable third option for many B.C. voters. Much of this is to do with the perception of the party’s leader. Andrew Weaver holds the highest favourability of the three candidates at 50 per cent.
Playing in his favour is the relatively low number of respondents who say they have a poor opinion of him (26%). Whether this will translate into votes is one of the main questions of the 2017 campaign:

Another element that may help the Greens is the emotional appeal of their candidate. Weaver has stated that he believes British Columbians are looking for “someone to vote for instead of against”. When asked who they would support if they voted strictly based on their ‘gut’ or ‘heart’, Weaver is the choice of four-in-ten (40%). Notable segments of BC Liberal and NDP voters say the same:

Who has momentum?
Four-in-ten British Columbians (39%) say their opinion of Clark has worsened since the campaign began, compared to just 5 per cent who say it has improved. Horgan fares better, but is still trending in a negative direction. Nearly three-in-ten (28%) say their opinion of him has worsened, compared to 15 per cent who say it has improved.
On this measure, Weaver has a distinct advantage. He’s the only leader about whom more B.C. residents say their opinion has improved (27%) than say it has worsened (12%).
Subtracting the percentage who say “worsened” from the percentage who say “improved” yields a “momentum score,” which can be used to more easily compare the data on each leader. As seen in the following graph, Weaver is the only leader with a positive momentum score as the campaign draws to a close:

Clark receives relatively low positive momentum scores from solid BC Liberals, and receives a negative score from soft Liberals. Her scores are overwhelmingly negative among NDP and Green voters:

Horgan’s negative overall score comes largely from the negativity of both Liberals and Greens, who say their opinion of him has worsened since the campaign began:

In comparison to the Liberal and NDP leaders, Weaver is regarded much more positively:

PART 5 – Vote dynamics
The Risk Factor:
Is it too risky to give the NDP a chance to govern British Columbia? The BC Liberals have been making that case since they wrested power way from New Democrats in 2001.
Roughly half of all B.C. residents (49%) seem to share this view, while the other half (51%) say “it’s not too risky to change government; the BC NDP is a better choice than keeping the BC Liberals in power.”
Responses to this question break down predictably along party lines, with Liberal supporters – both soft and solid – feeling it’s too risky to change government, and NDP supporters feeling it’s not:

One factor that could potentially influence the decisions of soft voters across the political spectrum is the expected outcome of the election.
More than four-in-ten (44%) expect the BC Liberals to win this election and form government for a fifth consecutive term. That’s more than one-and-a-half times as many as expect an NDP victory (25%).
Among Liberals, eight-in-ten (80%) expect a victory for their preferred party – a degree of confidence not seen among supporters of the NDP when considering their own party’s prospects:

This confidence among Liberals could leave some of them feeling assured of the outcome. Couple that with the fact that more than one-in-four soft Liberals (26%) say they would feel “neutral” about an NDP victory, and a decline in Liberal turnout appears possible.
Overall, British Columbians are more likely to be pleased about an NDP win than a Liberal one:

Strategic Voting:
As previously mentioned, the Green vote is far softer than the NDP or Liberal vote. Most would-be Green voters in this poll say they could change their minds before election day.
These soft Green voters are among those most likely to say they would consider “strategic voting” – changing their vote in order to defeat a candidate they don’t like, rather than supporting a candidate they like, but don’t believe can actually win.
Most soft Greens say they would at least consider doing this, though it’s worth noting that soft NDP voters would too:

A significant segment of solid NDP supporters are also largely inclined to say they would consider voting strategically, though the fact that they’ve self-identified as “absolutely certain” they will support the New Democrats makes it harder to imagine them following through on this consideration.
The willingness of solid NDP voters to say they would consider strategic voting is more likely a reflection of their anyone-but-the-Liberals mentality – 82 per cent say they could never support the Liberals in this election.
A majority of soft Green voters (58%) also say they could never support the Liberals, while just over one quarter (27%) say they could never support the NDP.
This suggests that the New Democrats would have more to gain from a potential collapse of Green support in the final days of the campaign. Indeed, 48 per cent of soft Greens say their second-choice would be the NDP, as seen in the following graph:

Of course, the Green Party would also stand to benefit from a potential NDP collapse. Full majorities of soft (66%) and solid (53%) NDP supporters say the Greens would be their second choice. This scenario seems decidedly less likely, however, given that the Green Party has only ever had one member (Weaver) elected to the legislature.
PART 6 – The Choice
Ultimately, British Columbians’ perceptions of issues, assessments of their own lives, and opinions of what each party and leader may offer come down to one thing: the choice.
Between April 28 and May 3 – the period during which the Angus Reid Institute was in field – the choice of B.C. voters was far from a consensus.
Taking into account the margin of error a probability sample of this size, we see a range of outcomes for each party had an election been held during the fielding window:

Overall vote intention does not tell the whole story however. The parties either hold significant leads or are competitive in different parts of the province.
In the Lower Mainland region (encompassing Vancouver, Richmond, Burnaby, New Westminster, Coquitlam, Port Coquitlam, and the Central and Northern portions of Surrey), the NDP holds a clear and commanding advantage.
In suburbs further afield (including South Surrey, Langley, Abbotsford, Mission, Pitt Meadows, Maple Ridge, Chilliwack, Hope, White Rock, Delta, West Vancouver, and the southern portion of the Sunshine Coast) the roles are reversed – and it is the BC Liberals with a near 20-point lead.
Voters on Vancouver Island and the North Coast (including the Gulf Islands, Powell River and the northern part of the Sunshine Coast), long an NDP stronghold, are indicating a more divided vote intention, putting the incumbent party and the NDP in a dead heat.
The BC Liberals continue to hold a lead in the Interior, where voters in the Thompson-Okanagan region, the Kootenays, the Cariboo region, and Northern B.C. give them the edge.

This unevenness in party support is not only noted regionally. As it has in the past, the B.C. electorate is also split significantly along generational lines:

Given the demographic differences in competitive edge for the parties, the election outcome may ultimately depend on a number of key factors, including:
- NDP-Green dynamics
- Turnout by Age
- BC Liberal “Sleepers”
NDP-Green Dynamics:
Media and political watchers love a third-party narrative in election campaigns, one in which a party with previous fringe status becomes a contender, both in terms of seats won and popular vote. Election 2017 has the potential to provide that. The Greens of BC – holding a range of 12-18 per cent of vote intention province-wide, stand to build on their support among less-certain voters.
Indeed, among soft NDP voters – roughly 40 per cent of the party’s base – fully two-thirds (66%) say the Greens would be their second choice. Further, a quarter (26%) of those softer NDP voters say their view of Green leader Andrew Weaver has improved in recent weeks.
Combine this with Horgan’s inability thus far to break away from Clark on the question of who would make the best Premier, and a sense that on the question of big money in politics, the NDP holds no higher ground than the BC Liberals. John Horgan, therefore, must convince these soft New Democrats to lock in by May 9.
This is especially true on Vancouver Island, where the NDP to has been able to paint the region – particularly the South Island – bright orange in the past. This year may prove more of a headache for the New Democrats. Now in a two-way tie with the BC Liberals on the Island, and with the Greens holding the support of some one-in-five, the NDP will have to devote energy and resources to ensuring seats that might have once been considered “gimmes” stay in their column. This is time, money, and people hours that could have been deployed shoring up support in other battlegrounds.
Turnout by Age:
The whopping 27-percentage-point lead voters aged 18-34 give the NDP would be reason for supporters to begin popping champagne corks in anticipation of victory, but for the very hard fall New Democrats experienced four years ago by counting on a notably fickle bloc.
To remind everyone: in 2013, overall turnout was 57.1 per cent of registered voters, according to Elections BC. Among the 25 – 34-year-olds who make up much of the NDP base, turnout was just 39.8 per cent.
Among voters under age 45, fewer than 50 per cent of registered voters actually cast ballots. By contrast, turnout in the last election was highest among those ages 65 – 74, nearly three-quarters of whom (74.2%) cast ballots. This time around, voters aged 65+ give the BC Liberals a 17-point lead.
One might conclude that the millennials, an age group most likely to agree that “too many people in BC are being left behind” (81%), and least likely to agree that “if you work hard in BC, you will find success” (49%) would be strongly motivated to turnout in large numbers. Perhaps they will, though past experience would suggest wisdom in tempering this expectation.
BC Liberal “Sleepers”:
The fact that nearly all soft Liberal voters find the prospect of an NDP government “too risky” suggests they’re unlikely to break to another party on election day. That said, their other responses to this survey – particularly their negativity toward Christy Clark – suggest that some of them could decide not to vote at all.
If they do change their minds, their second choice is for the Greens over the NDP by a ratio of two-to-one (39% versus 19%). However, they are just as likely to indicate they have no second choice (22%) as they are to favour the NDP. In a tight race, the decision among this key cohort of voters to lock in with the Liberals, switch to the Greens, or simply stay home and not vote will undoubtedly have an impact on the outcome.
Concluding Analysis – Paths to Victory:
The analysis in this final section should not be mistaken for a seat projection based on provincial or regional level polling. However, in addition to the many dynamics beyond vote intention that will impact the final result, a canvassing of a few key races may add further insight.
With 47 BC Liberal seats in the legislature, and 44 needed to form a majority government, it would appear there is less pressure on the BC Liberals to pick up new seats than to maintain what they have.
New Democrats, by contrast, must hold all 35 seats that they held going into the election and pick up nine more. Their path to victory may be limited by a lack of evenly spread support across the province. Thus, battles in and around Metro Vancouver – and on Vancouver Island – may ultimately decide this election.
Despite their apparent underdog status in the core of Metro Vancouver, the BC Liberals could conceivably pick up a seat (Coquitlam-Burke Mountain) lost in a by-election to the NDP.
The BC Liberals also stand to pickup three seats as a result of two new constituencies and one retiring MLA. In Surrey South, a new riding, two-time incumbent Stephanie Cadieux is considered a favourite by many. In Richmond-Queensborough, former TV personality Jas Johal will be standing in a new constituency, part of which has voted solidly BC Liberal since 1991. And Delta South, once a BC Liberal stronghold, could return to the party’s fold now that Independent member Vicki Huntington is stepping down.
Saanich North and the Islands is arguably up for grabs: held for a few terms by the BC Liberals, it was a pickup for the NDP in 2013. This time, it could be a breakthrough second seat for the Greens of BC.
The NDP and Liberals could split a two-seat battle in Burnaby, a hotbed of opposition to the proposed twinning of the Kinder Morgan TransMountain pipeline. In Burnaby North, the NDP could defeat BC Liberal incumbent Richard Lee in a swell of anti-pipeline anger. In Burnaby-Lougheed, former TV anchor Steve Darling may provide the BC Liberals with enough name recognition to take the seat back from the New Democrats.
Seats in Surrey could change hands in favour of the NDP: In Surrey-Fleetwood, Peter Fassbender, the minister responsible for TransLink, is facing a tough fight against former NDP incumbent Jagrup Brar. In Delta North, BC Liberal incumbent Scott Hamilton is considered by some to be under pressure from the NDP’s Ravi Kahlon. And in Surrey-Guildford, it is Amrik Virk, minister responsible for technology and innovation, fending off a challenge from the New Democrat candidate Garry Begg, a former RCMP Inspector.
The Angus Reid Institute (ARI) was founded in October 2014 by pollster and sociologist, Dr. Angus Reid. ARI is a national, not-for-profit, non-partisan public opinion research organization established to advance education by commissioning, conducting and disseminating to the public accessible and impartial statistical data, research and policy analysis on economics, political science, philanthropy, public administration, domestic and international affairs and other socio-economic issues of importance to Canada and its world.
Click here for the full report including tables and methodology
Click here for comprehensive data tables by region, age, gender etc.
Click here for comprehensive data tables by strength of party support
Click here for comprehensive data tables by voting intention
Click here for the questionnaire used in this survey
MEDIA CONTACT:
Shachi Kurl, Executive Director: 604.908.1693 shachi.kurl@angusreid.org @shachikurl
Image Credit – BC Election Consortium